Context
01
The Productivity Benchmarking Tool evaluates and provides guidance on productivity levels. Traditionally, our applications included internal guidance not visible to users. With the new guides provided by the Technical Lead, explicit recommendations are now available. This assessment categorizes deals based on their type or solution, offering threshold productivity guidance to measure the effort and productivity associated with each deal within an organization.
Productivity Benchmarking Tool
1
5+
3
My Role
Month
Screens
Tools
UX Designer (Collaborated with UX Researcher & 5 other designers)


03
Problem & SOLUTION
Problem
The application doesn’t have the proper tool to leverage the client’s needs. It is hard for the Technical Lead to categorize the deals, come up with a threshold, and derive the productivity of the output.
Solution
Create an assessment that fits the client’s resources and needs. Preview the output in an organized way, where it is properly measured and reviewed by all users.
02
Design process
Discover
Define
Ideate
Testing
Design
User Goals
User Persona
Empathy Mapping
Information Architecture
Usability Testing
Wireframes
User Flow
Hi-Fi Designs
Customer Experience
Map
04
Discover Phase
User Goals


Client’s Goals
Technical Lead’s Goals
Conduct a Comprehensive Assessment:
Evaluate deal types, automation strategies, tools, and processes to identify improvement areas.
Develop Actionable Recommendations:
Use assessment insights to create strategies that enhance operational efficiency.
Utilize User Feedback for Targeted Guidance:
Collect and analyze user inputs to provide tailored recommendations that boost productivity.
Embed Productivity Tools into Applications:
Integrate features that monitor and enhance productivity within existing applications.
Evaluate Effort and Productivity:
Implement systems to assess and ensure that productivity levels remain within set boundaries.
Classify Deals and Solutions:
Organize various deals or solutions to maintain clarity and adherence to organizational limits.
Solution & User Goals
Develop an assessment tailored to the client's resources and needs, ensuring the results are presented clearly and accessibly for all users. This approach facilitates accurate measurement and comprehensive review, promoting informed decision-making.


A Customer Experience Map is a holistic, all-encompassing visualisation of an experience, from beginning to end, that a customer will go through irrespective of a specific product. These maps are more concerned with human behaviour in general.
Initially the user has to have the details ready to start the assessment.
Visually, the elements are understandable.
Add a preview for suggestions.
There are too many options to choose from. Information Overload.
Organize theprocess in asking the user for the general questionnaires, rather than putting all the questions in one page.
The questionnaires are organized in group based on it’s topic.
Add visual for the progress of the user.
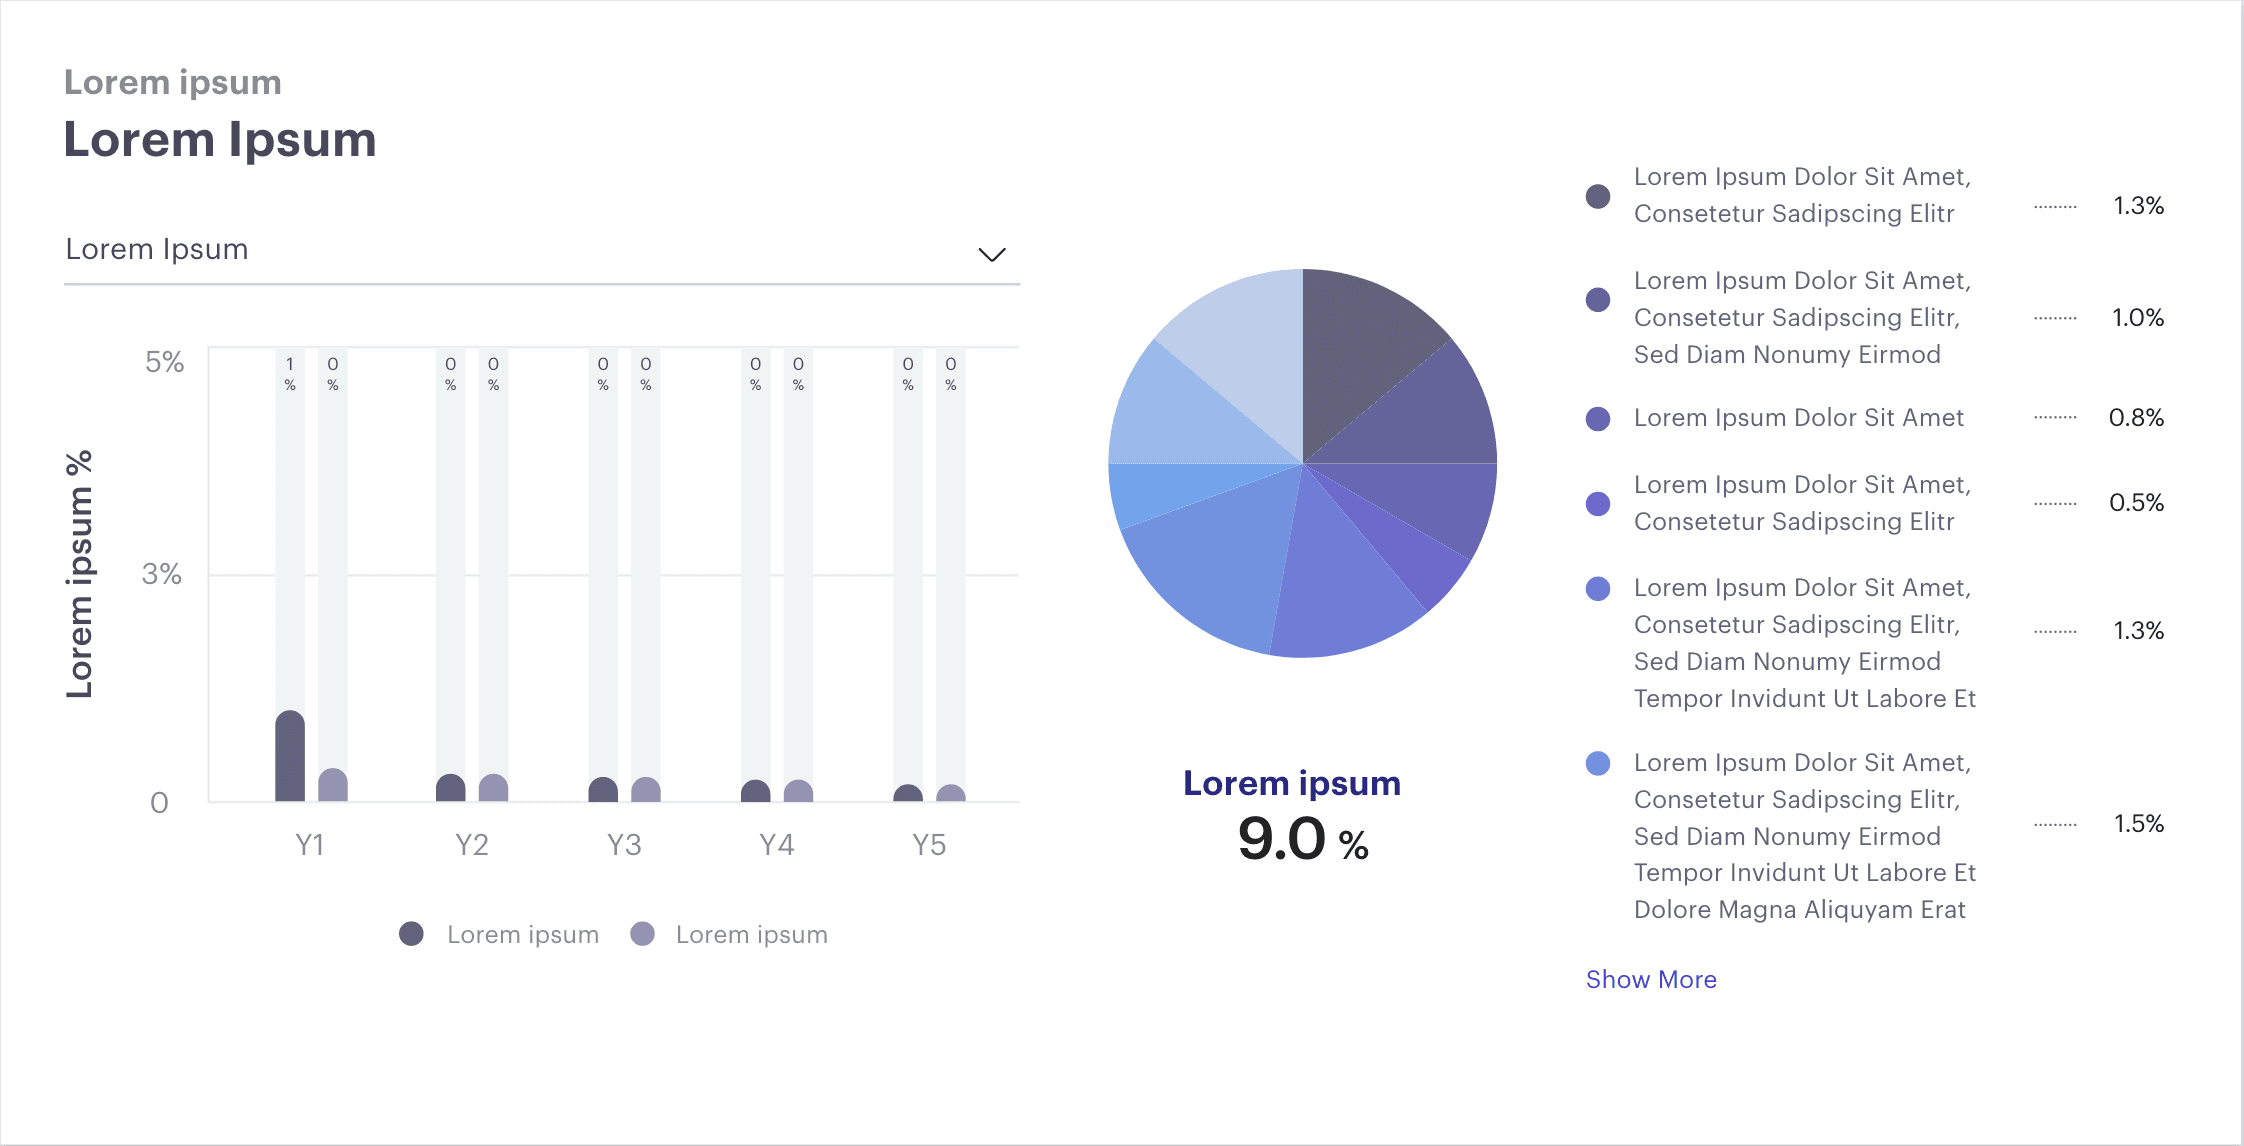
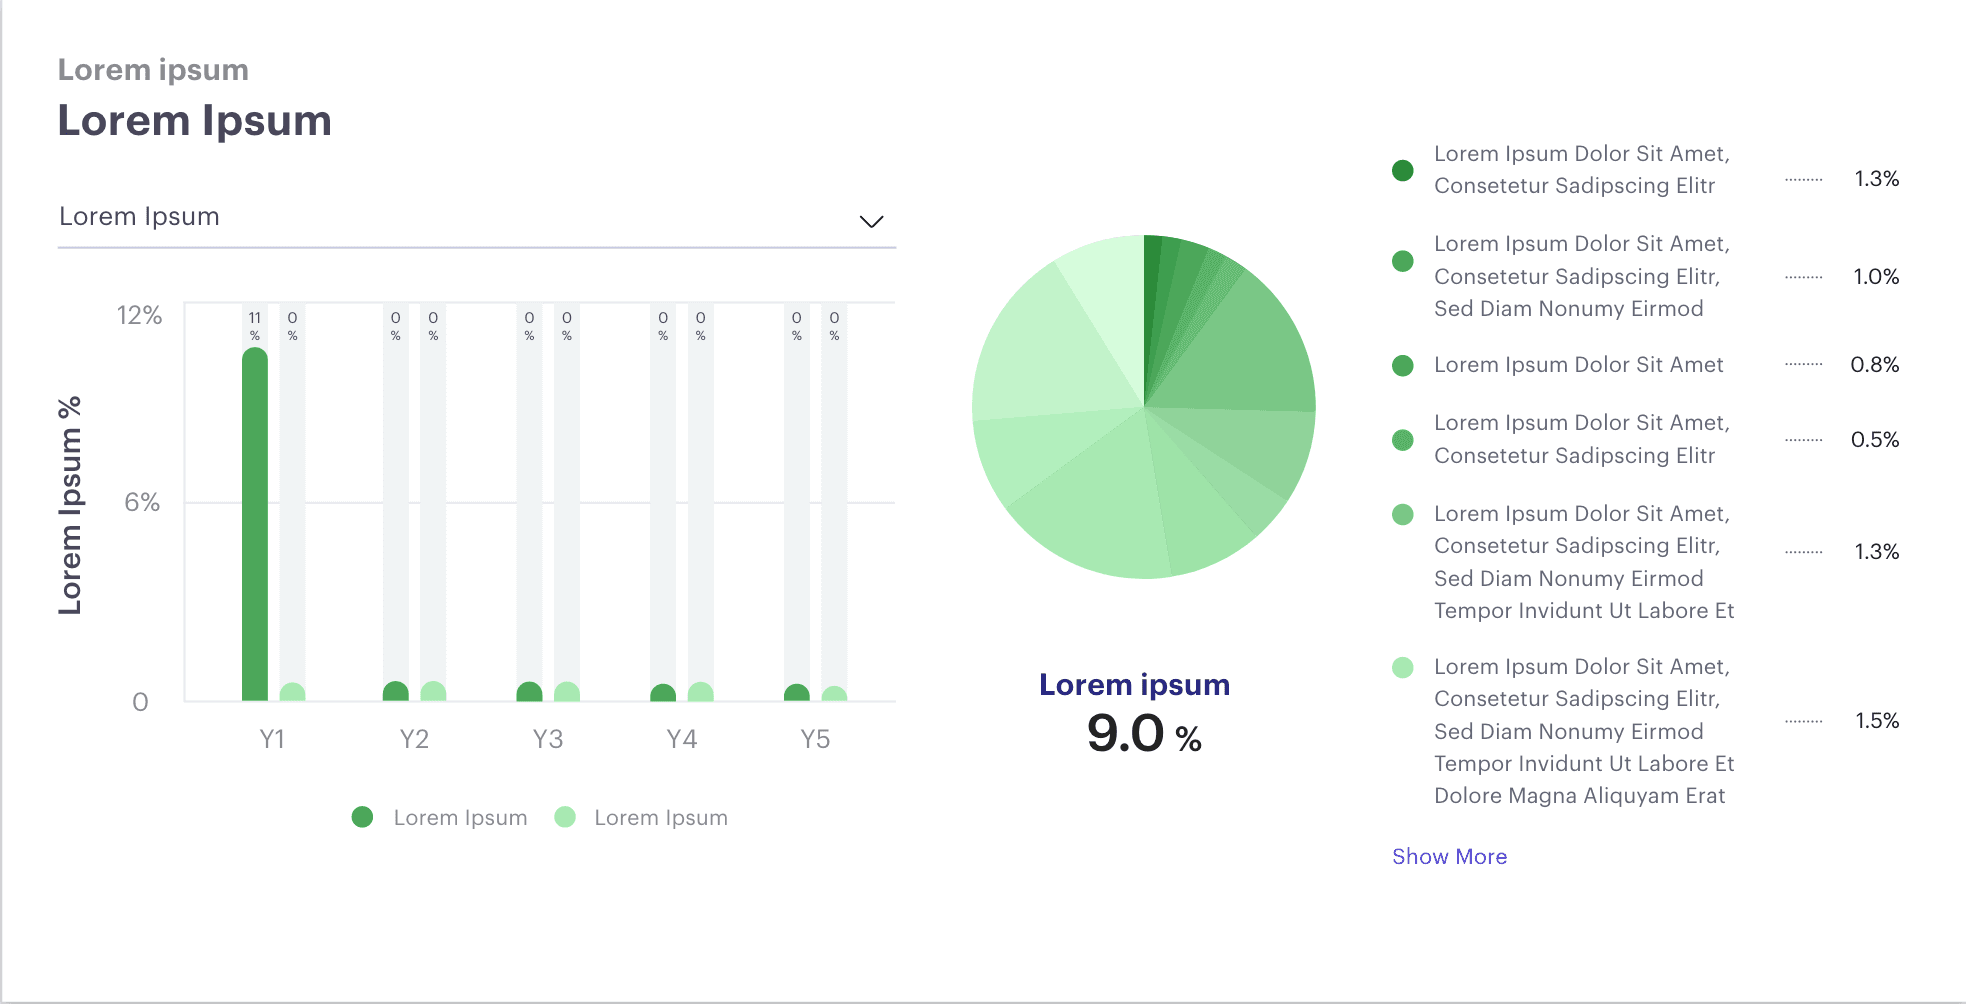
The graph view is much easier to understand since it is summarized, while the table has too much information displayed.
Graph view as the landing page gives a better impression of interpreting data visually.
Steps in editing Recommendation could be improved more user-friendly.
The information are in linear fashion and are organized in groups.
Provide a graph representation.
05
Customer Experience Mapping
Steps
Positive
Neutral
Negative
Experience
Opportunities
“Take Assessment”
Requirements Gathering
Productivity
Questionnaires
Output
Reports
Feelings
Based on the interview, we have created a persona representing an ideal user of the application. The persona helps us to arrive at a better solutions as it gave us an in-depth understanding of user goals, needs, pain points & overall personality.
06
Define Phase
User Persona

Jamie
App Development Assoc. Manager
Give an overall insights of the AWS services.
Takes the design and implements technical knowledge to deploy and develop solutions in applications.
“They have long intended to capitalize on this opportunity, and we are implementing it now.”
“Our primary objective is to utilize the assessment to integrate the automation platforms. Guidance will be formulated based on inputs provided by the technical lead..”
Use specialized tools to evaluate and understand client requirements.
Gather and interpret client input to develop precise guidance.
Implement tools to monitor and assess organizational productivity.
Ensure organizational strategies are tailored to meet identified client needs.
Implement surveys and interviews to gather detailed insights into user needs and preferences.
Systematically examine collected feedback to identify common themes and develop precise, data-driven recommendations.
Measure and maintain optimal productivity without exceeding limits
Organizations often require specialized tools to address their unique needs; currently, our team lacks such an application.There is a need to have a guidance which is currently not visible to the users.
There is a necessity to implement guidance features that are presently not accessible to users.
It is essential to thoroughly identify and address all client requirements to develop effective solutions.
Job Responsibilities & Purposes
Notable Quotes
Wants
🙂
Goals & Needs
🎯
Pain Points
😢
“Empathy Mapping” helped us to understand the perspective related to users thoughts & feelings. This process made clarity to their needs and actions. The data in the Empathy is based on insights from Interviews.
SAYS
THINKS
FEELS
07
Define Phase
Empathy Mapping
I expected Something different
I am looking for something
Useful
Over-whelmed
Why is this
so hard?
What do
You
Think?
Shouldn’t
this be
easier
Is there any
guidelines?
Doubtful
Excited
What Should I Look for?
Anxious
How can I meet my clients
expectation?
DOES
Compare the
data
Lists
Pros/cons
What else I am missing?
Check for the
recommendations
What is best
for me?
How can I meet
my clients
expectation?
I want
something
Awesome
Make small
Decisions
May be this
Isn’t the
best
08
ideate Phase
Information architecture

09
ideate Phase
User Flow
Start
Launch App
Choose
Assessment Type
Enter User ID
Choose Deal
& Begin
Initial Evaluation
Proceed to
Main Assessment
Get Recommendations
Submit
View Summary
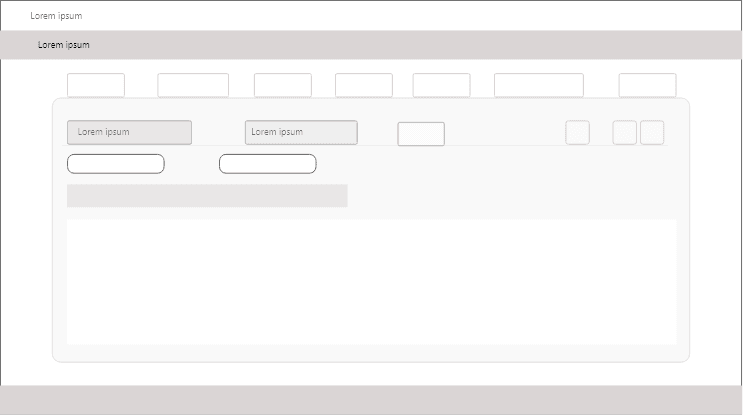
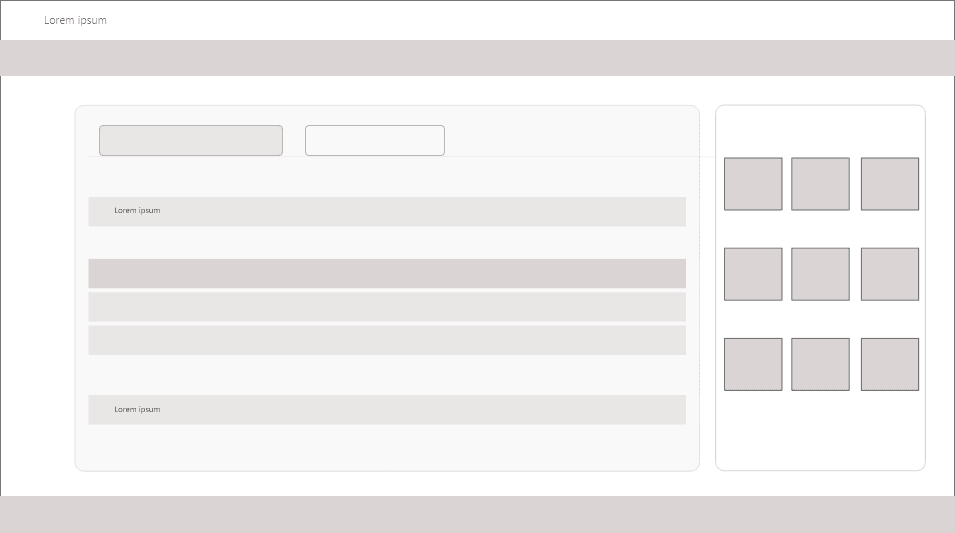
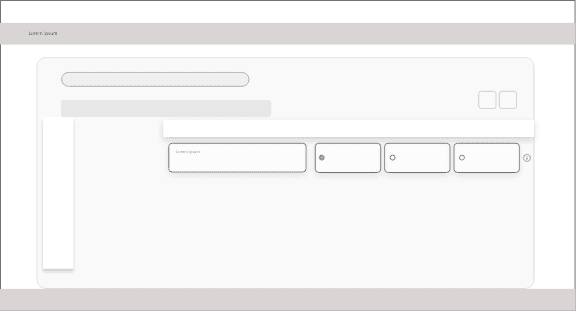
Low-Fidelity wireframe act as the initial blueprints for web pages. They help our stakeholders to focus on a page’s key purpose and functionality by deliberately excluding any specific details like colours, fonts, exact sizing-all of which can be added later.
10
design Phase
Low fidelity wireframe

After completing High Fidelity, wireframe, we tested the prototype with 5 respective users to check how friendly the application is in this stage. The user were given the following tasks, while we observed how they navigated through the task given:
Entering the details before the Assessment.
Productivity Assessment:
Choosing where to take assessment (MyWizard/Estimator/mySP) & enter the details for Productivity Assessment.
Going through each sections and answering through all the AM & AD Questionnaires.
Switch between Graph & Table View on Output.
Navigate between the Work Type Tabs, and Tech Stacks.
Expand the Levers to open the Sub-Levers.
Edit the data of the Solution Recommended Productivity on a Sub-lever.
Add a Custom Lever.
Open the KDA Reports.
The user needed to go to the previous pages to know what to enter on the details.
The user didn’t understand the differences of the first part.
Had to ask the functions of most questions.
The user skimmed through the questions and was able to answer everything.
The user said he/she was expecting some icons to be used for visuals.
The user wasn’t able to start the task itself. Gave up finding the function.
The user tried all the buttons on the top before reaching the specific button.
11
testing Phase
User Testing Report
Task
Completed the
task easily
Able to
Complete
Difficult to
Complete
Not able to
Complete
Remark
✅
✅
✅
✅
✅
✅
✅
✅
✅
UI UX Design
2025
Productivity Benchmarking Tool
Web Application Design